


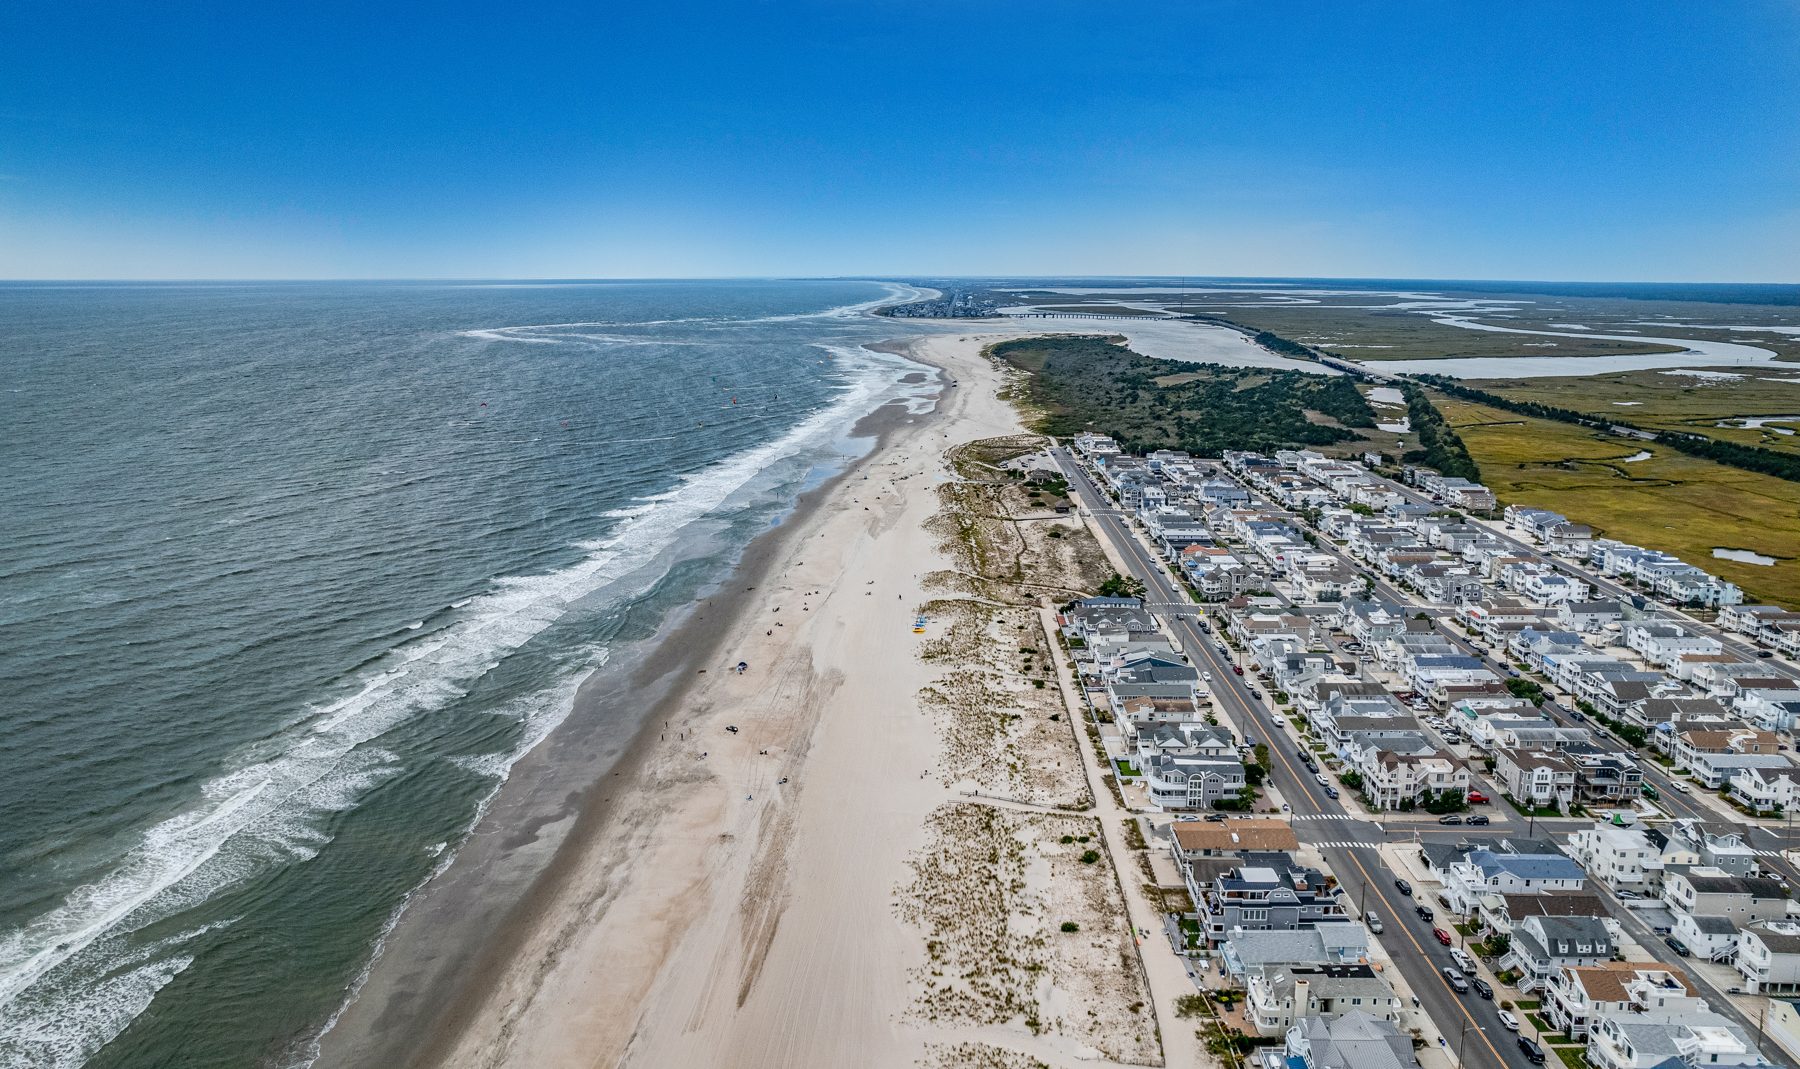
Here is where the Ocean City, NJ housing market stands as of November 1, 2026: 57 homes sold in the past 30 days, 229 are on the market, and the island has about 4.5 months of supply. Below are the numbers for all 11 neighborhoods and what they mean if you are buying or selling.
The big picture
Sales have slowed with the end of the season: 57 homes sold in the past 30 days, against 79 in the 30 days before that. Prices have held up, though. The average asking price of homes that sold in the past 30 days was $1.65M, about the same as the $1.63M in the 30 days before. Over the past three months, 171 homes sold at an average asking price of $1.59M, up from $1.53M in the three months before, and those homes were listed at about $912 per square foot on average, compared with $874 over the full year.
Since our October report, the number of homes for sale has dropped from 240 to 229, and months of supply has eased from 4.7 to 4.5. With 229 homes listed and about 50 sales a month, Ocean City has roughly 4.5 months of supply. A common rule of thumb is that under six months of supply favors sellers, though in Ocean City it varies a lot by neighborhood and price.
Condos and duplex units drive the market
71% of the homes sold in Ocean City over the past year were condos, many of them up-and-down and side-by-side duplex units. They sold at an average asking price of $1.10M (about $835 per square foot), against $2.54M for single family homes (about $981 per square foot).
Single family homes for sale today are asking an average of $3.94M, well above what singles sold for over the past year, which suggests the homes on the market now lean toward newer and larger properties. Supply is similar for both: about 4.3 months for single family homes (56 for sale) and 4.5 months for condos (162 for sale).
Neighborhood by neighborhood
| Neighborhood | For sale | Sold, 12 mo | Avg asking, sold | $/sq ft, sold | Months of supply |
|---|---|---|---|---|---|
| Gardens | 21 | 40 | $2.89M | $1,066 | 6.3 |
| North End | 31 | 134 | $1.27M | $828 | 2.8 |
| Bay Area | 19 | 42 | $1.51M | $827 | 5.4 |
| Central | 82 | 142 | $1.00M | $786 | 6.9 |
| Riviera | 9 | 21 | $3.49M | $1,149 | 5.1 |
| 18th to 34th Street | 12 | 64 | $1.15M | $839 | 2.2 |
| Merion Park | 0 | 12 | $1.20M | $717 | 0.0 |
| OC Homes | 2 | 6 | $1.60M | $776 | 4.0 |
| Gold Coast | 28 | 47 | $2.04M | $999 | 7.1 |
| Bay Landings | 2 | 7 | $1.70M | $794 | 3.4 |
| South End | 23 | 91 | $1.48M | $917 | 3.0 |
The tightest markets right now, among neighborhoods with at least 20 sales in the past year, are 18th to 34th Street (2.2 months), North End (2.8 months) and South End (3.0 months). The most supply is in Gold Coast (7.1), Central (6.9) and Gardens (6.3). Higher supply often goes with higher price points, so check the asking prices before reading too much into it. Since last month, supply fell in Gardens, Bay Area and Gold Coast as listings came off the market, while South End added listings. Merion Park, OC Homes and Bay Landings have only a handful of sales a year (Merion Park has no homes listed at all right now), so treat their figures as rough.
What it means for you
Buying: November through the winter is often the best time to negotiate in Ocean City. Sales slow after the summer and fall, there are fewer buyers on the island, and some second-home sellers would like a deal done well before next summer's rental season. Inventory is thinner than it was a month ago, so in the tighter neighborhoods, expect well-priced homes to draw attention regardless of the season.
Selling: with fewer homes on the market, a well-priced listing faces less competition this winter, and buyers shopping now are often planning for next summer. Pricing is block by block, so the citywide averages above are only a starting point. A home on a beach block, with a strong rental history, or in one of the tighter neighborhoods can do much better than the island average. Get a free valuation based on the sales around you.
Want to see the homes behind these numbers? Browse homes for sale in every Ocean City neighborhood, or check the live beach and boardwalk cams to get a feel for each part of the island.
About these numbers: figures come from MLS listings on our site as of November 1, 2026 and include single family homes, condos, townhomes and multifamily properties in Ocean City. Prices are the asking prices of homes that sold, not final sale prices; price per square foot covers only listings that report square footage; months of supply is homes for sale divided by average monthly sales over the past year. MLS data changes daily. Questions about a specific property? Call or text Graham at (609) 602-4884.